How do I view Usage Trends in Ask Your Data?
How do I view Usage Trends in Ask Your Data?
How do I view Usage Trends in Ask Your Data?
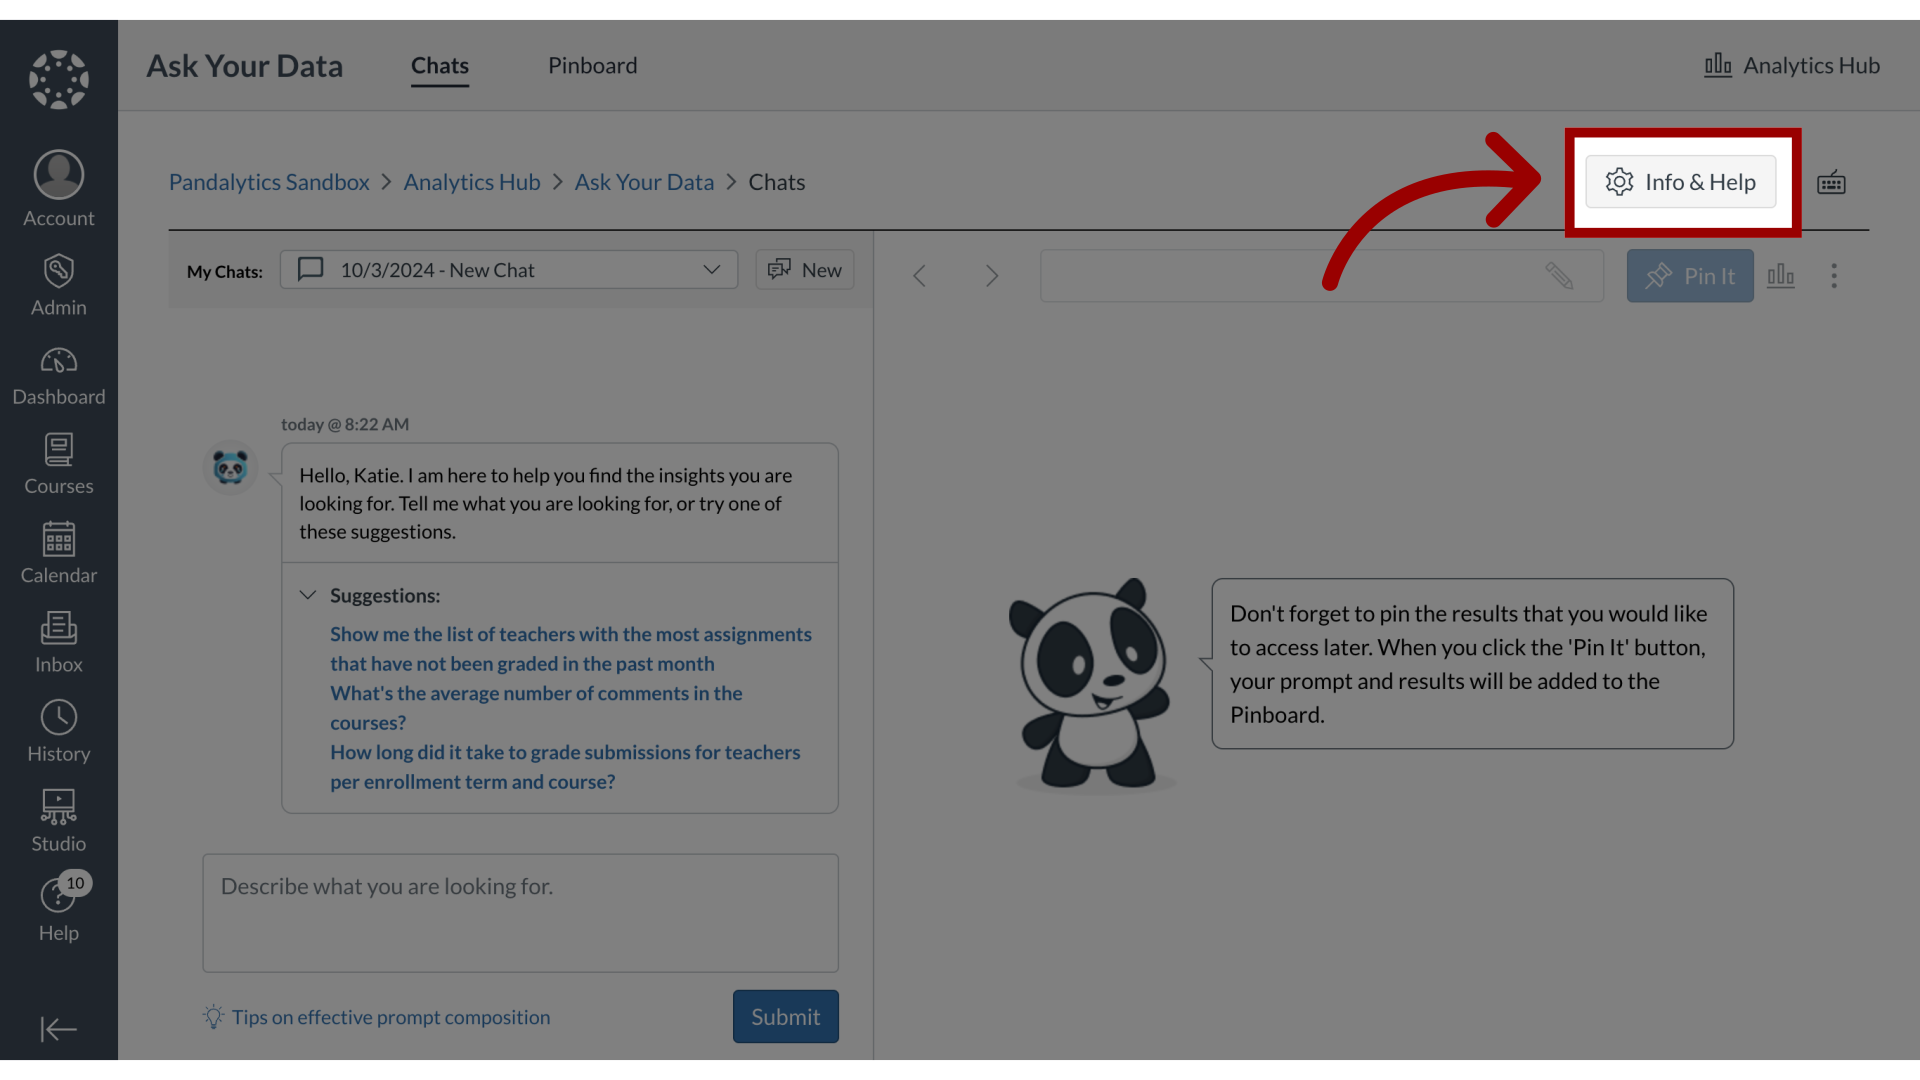
1. Open Info and Help
In the Ask Your Data Chats dashboard, click the Info and Help button.
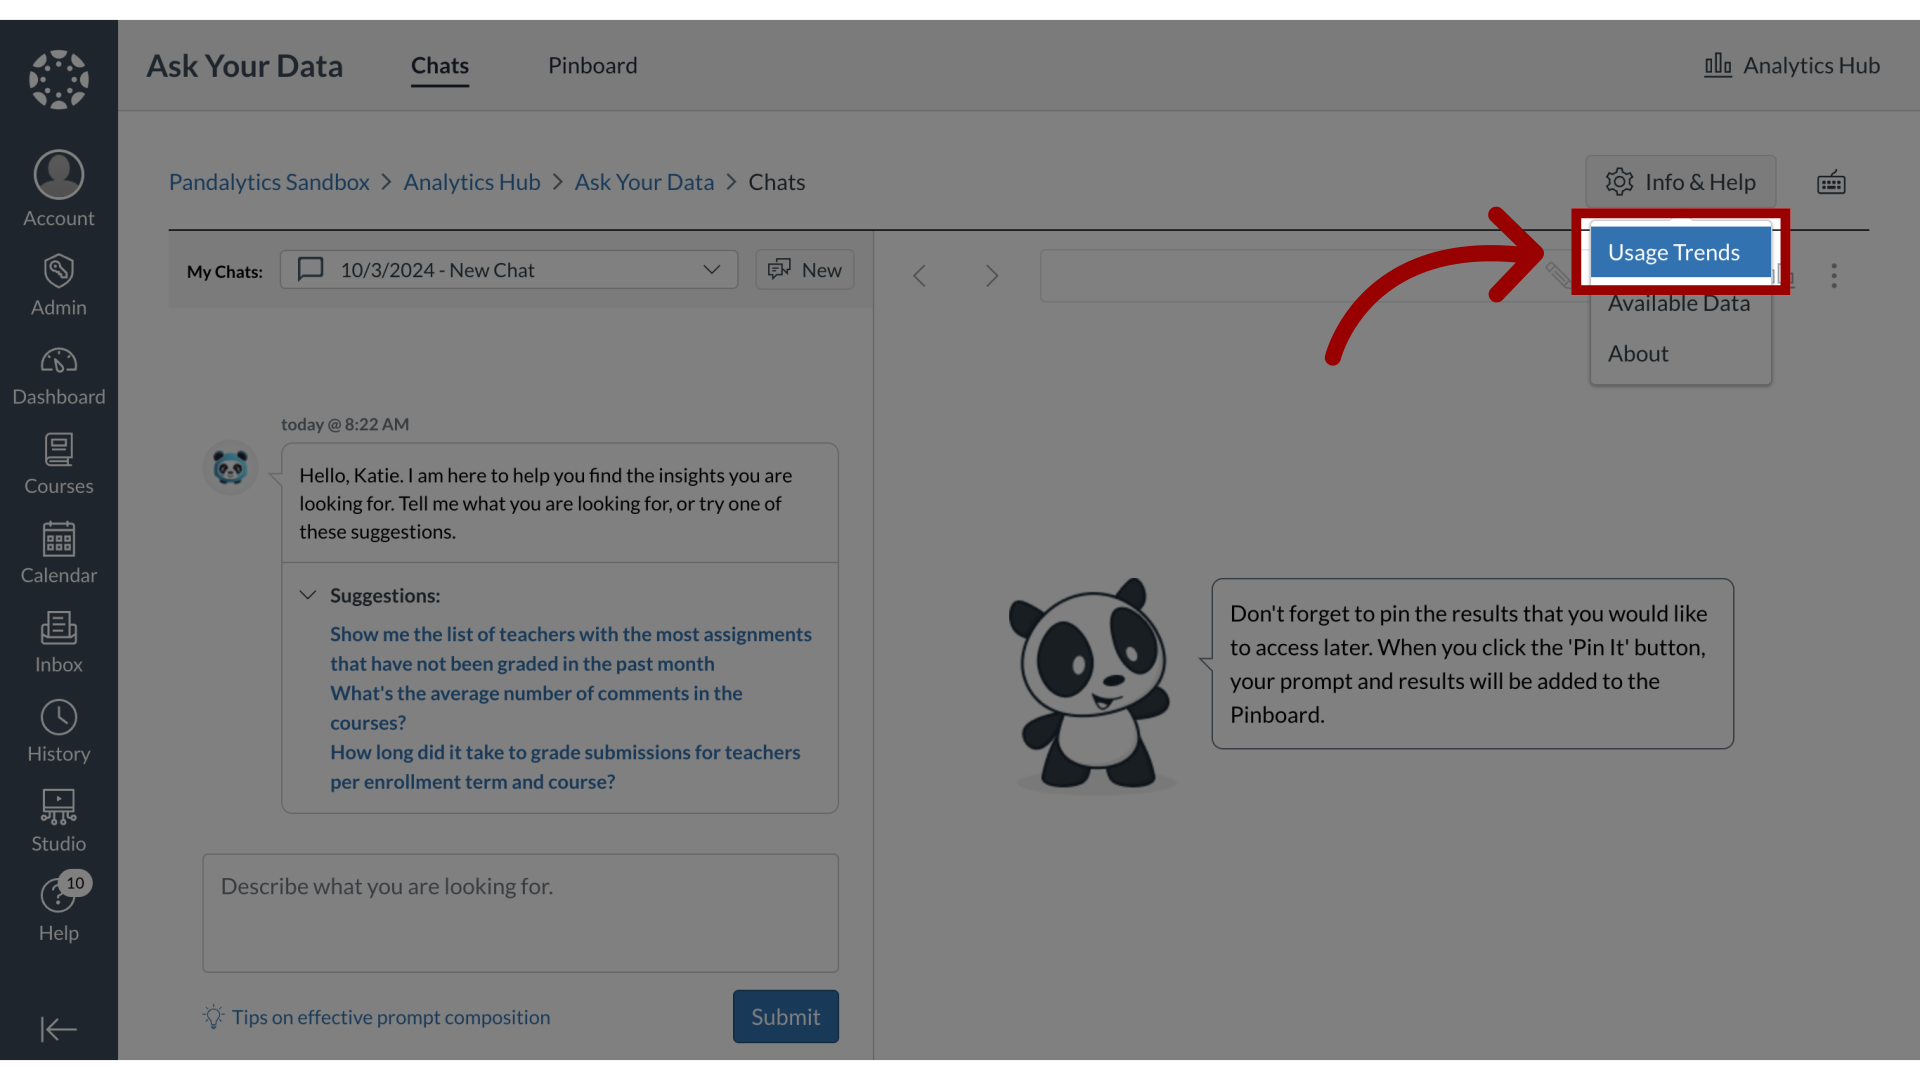
2. Open Usage Trends
Click the Usage Trends link.
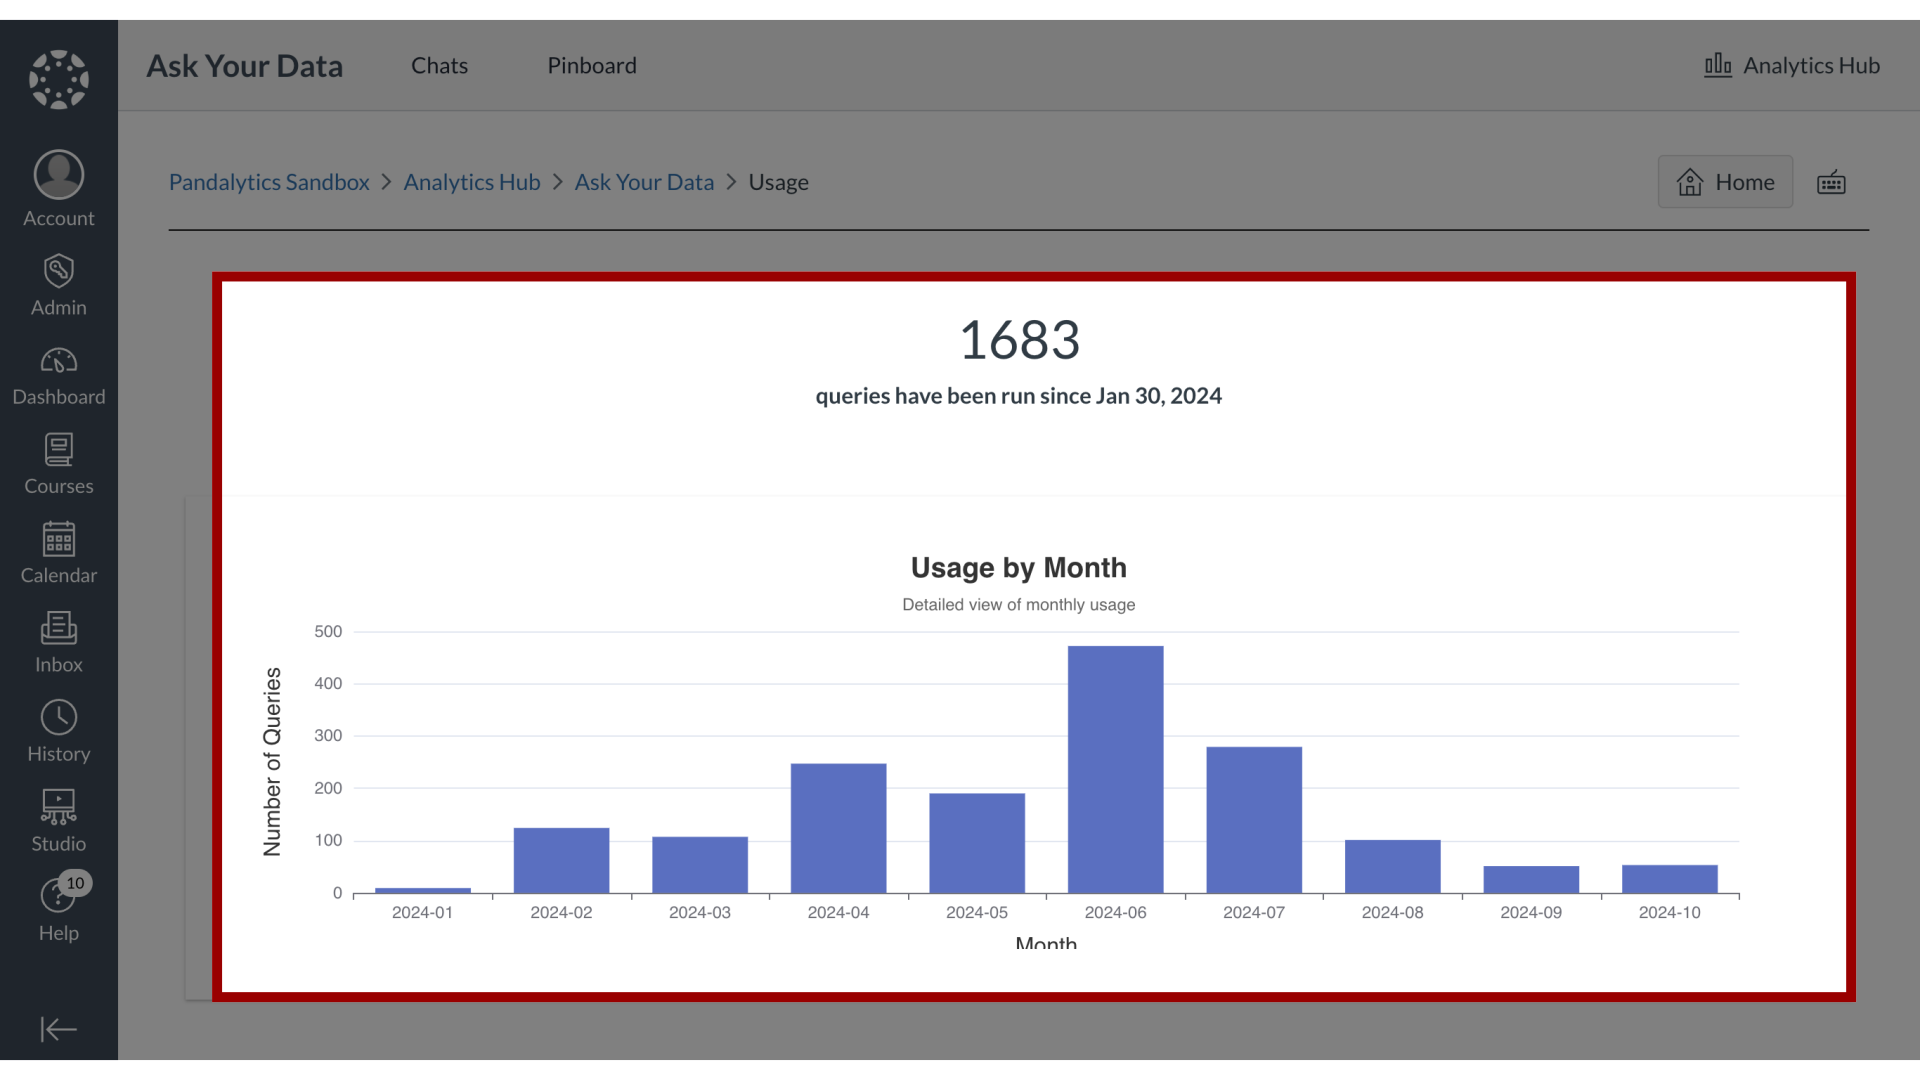
3. View Usage Trends
The Usage Trends dashboard displays with the total number of queries that have been run since a certain date. The Usage Trends chart displays the number of queries by month.
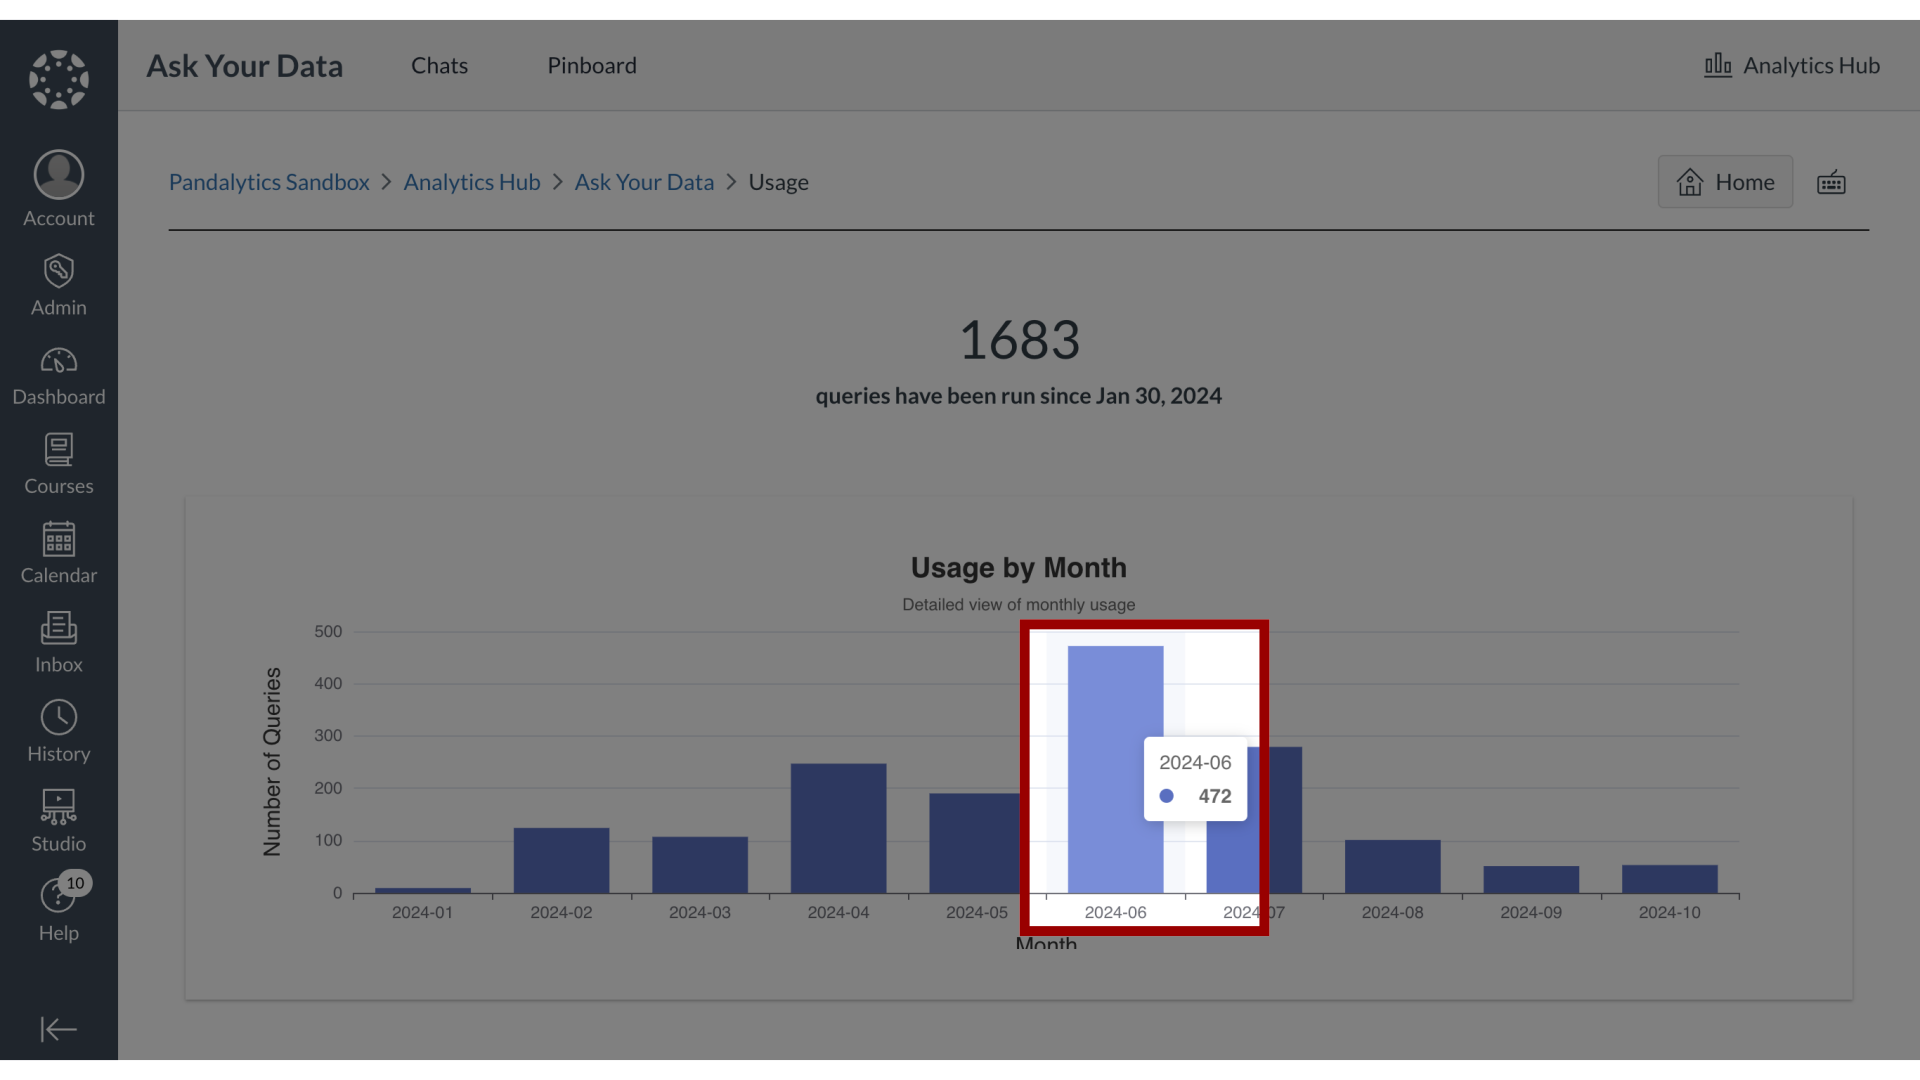
4. View Monthly Queries Details
To view specific monthly query details, click the month bar.
This guide covered how to view Usage Trends in Ask Your Data.
